Latest News
* SEDE Network Exclusive *
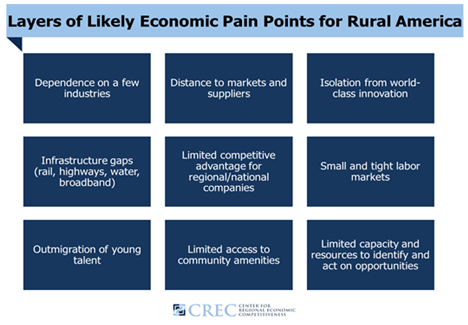
State Approaches to Developing Rural Economies (CREC and Entreworks). Rural America faces unique challenges in building thriving economies – stemming primarily from geographic remoteness which makes routine economic interactions more difficult and costly for businesses. This is borne out by indicators that show declining population, limited employment opportunities, and lack of public investment that highlight potential negative consequences on the enduring economic vitality of rural communities. When rural areas decline, this sets in motion a vicious cycle of further disinvestment and decline. Rural job growth, for instance, has lagged the gains in urban areas since the Great Recession, causing rural residents to look increasingly outside their communities to find new work and opportunities. This further reduces the talent and local leadership available to build future prosperity.
This white paper developed for the State Economic Development Executives (SEDE) Network describes state approaches and promising practices for rural economic development based on recent research findings and the collective wisdom of state economic development officials for improving and expanding rural regions.
State Economic Performance
Fifty State Budget Report Cards Released (Volcker Alliance). State Budget Sources is designed to provide improved tools for public officials, policy advocates, journalists, academics, and concerned citizens researching the critical fiscal decisions states must make. The guide includes the Volcker Alliance’s exclusive State Budget Report Cards, which grades state budgeting practices, from A to D-minus, based on five areas of best practices necessary for a transparent and sustainable budget: budgeting forecasts, budgeting maneuvers, legacy costs, reserve funds, and transparency. A clickable map provides information for each state and is accompanied by a downloadable PDF of each report card.
Topics and Trends
Industry Watch
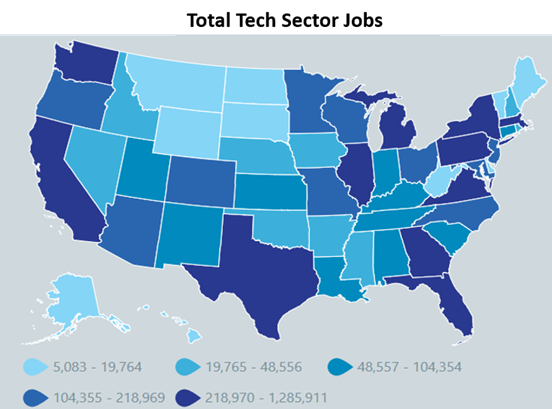
Information Technology Industry Continues to Grow (CompTIA). The global information technology industry is on pace to reach $5 trillion in 2019. The enormity of the industry is a function of economies, jobs, and personal lives becoming more digital, more connected, and increasingly, more automated. Waves of innovation build over time, powering the technology growth engine that appears to be on the cusp of another major leap forward. The United States is the largest tech market in the world, representing 31% of the total, or approximately $1.6 trillion for 2019. In the U.S., as well as in many other countries, the tech sector accounts for a significant portion of economic activity. CompTIA’s Cyberstates report reveals the economic impact of the U.S. tech sector, providing an interactive map and dashboard to explore the tech sector in states and key metro areas across the United States.
Trade/Tariffs
US Tariffs on China Jump as Deadline Passes, China Says it will Retaliate (CNBC). The U.S. is hiking duties on $200 billion worth of Chinese products from 10% to 25%. It had been hoped that a resolution could be reached by the two sides prior to the deadline for the tariff hike, but no deal materialized. For industries and businesses affected by the tariff hike, it will apply to goods exported after May 10, according to the Office of the U.S. Trade Representative. It will not affect products already in transit to the United States. The U.S. has prepared to put even more pressure on China, threatening to slap 25% tariffs on $325 billion in Chinese goods that remain untaxed as it aims to resolve grievances such as intellectual property theft, forced technology transfers and trade deficits. China took a tougher stance in negotiations after getting a sense the U.S. may be willing to compromise believing the US economy was in worse shape than publicly reported.
Opportunity Zones
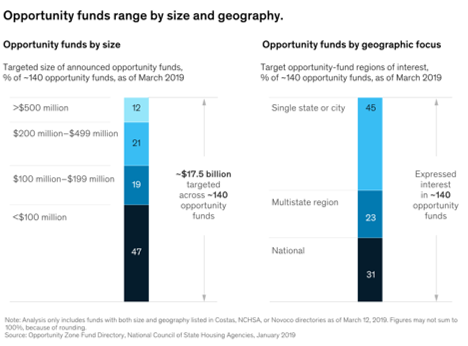
Making the Most of US Opportunity Zones (McKinsey & Company). The sheer number of opportunity zones and the volume of capital they are expected to attract create a daunting challenge for investors choosing between locations and projects. As of March 2019, more than 230 so-called “opportunity funds” are collectively seeking to raise upward of $25 billion across a range of investments. The funds are geographically diverse, with nearly half focusing on specific states, a quarter focusing on investments across a specific region, and the rest open to any investment opportunities nationwide. As interest in the opportunity-zone program has grown, many states have begun taking steps to build on the program’s promise. McKinsey recommends the following five steps for states: 1. Develop a statewide opportunity-zone strategy; 2. Understand the needs of opportunity-zone census tracts; 3. Build a detailed investor prospectus; 4. Consider coordinating targeted state and local incentives with capital investments; and 5. Use online and in-person channels to align and excite stakeholders.
Opportunity Zones a ‘Game Changer’ for Entrepreneurs (Fox Business). AOL co-founder and former CEO Steve Case believes investments in opportunity zones will create a terrific place for entrepreneurs to cluster. According to Case, fifty years ago when you wanted to reinvent a neighborhood, you brought artists in from places like SoHo in New York. Now to reinvent communities, you want to bring the entrepreneurs in. However, communities need to build the infrastructure to support them like co-working space, mixed-use developments, and to be supportive of those entrepreneurs. He believes opportunity zones can create that incentive for investors to back some of the companies that are either in opportunity zones or might move to opportunity zones, which can be a game changer. For more information on Opportunity Zones, our partners at CDFA have extensive resources available, click here.
Opportunity Zone Rules Leave Out Data Reporting, Penalty Details (Bloomberg). Proposed rules on opportunity zones left some holes, such as the breadth of data the government has the authority to collect on the funds and how the Internal Revenue Service will handle penalties. The extent to which the IRS and Treasury Department will provide answers is unclear. Officials have said publicly that there will be three tranches of rules, with the April 17 batch being the second (REG-120186-18). But a Treasury official told reporters when the rules were released that the department doesn’t have a set plan for a third round, and this latest batch could be the last depending on the reactions of people invested in opportunity zones.
The Opportunity Zones program provides a tax incentive for investors to re-invest their unrealized capital gains into Opportunity Funds that are dedicated to investing into Opportunity Zones designated by the chief executives of every U.S. state and territory. Treasury has certified more than 8,700 census tracts as Qualified Opportunity Zones (QOZs) across all states, territories, and the District of Columbia. For a map of all designated QOZs, click here.
Inclusive Growth
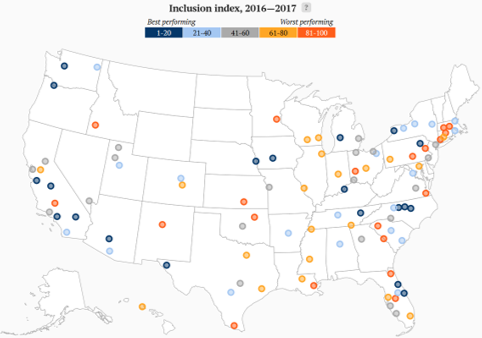
Inclusion Remains Elusive Amid Widespread Metro Growth and Rising Prosperity (Brookings). Truly inclusive economic growth remains rare in metro America. Over the decade from 2007 to 2017, most metro areas (64) made progress on prosperity indicators, but only a minority did so on inclusion (29), racial inclusion (26), and growth (10). As a result, only one metro area—Denver—posted across-the-board improvements in all four areas. The number of metro areas making progress between 2016 and 2017 was: 77 for growth, 71 for prosperity, 24 for inclusion, and 24 for racial inclusion. These relatively rare instances of inclusive economic growth demonstrate that even as most metro areas have rebounded to pre-recession levels of output, jobs, and living standards, other changes in the economy and labor market have mostly served to widen their gaps by race and income.
Innovation
Women Still Comprise a Small Minority of Patented Inventors (US Patent & Trademark Office). The United States Patent and Trademark Office (USPTO) recently released a report, Progress and Potential: A profile of women inventors on U.S. patents, on the trends and characteristics of U.S. women inventors named on U.S. patents granted from 1976 through 2016. The report shows that women still comprise a small minority of patented inventors and highlights an untapped potential of women to spur innovation in the United States. Among the findings: The share of patents that include at least one woman as an inventor increased from about 7 percent in the 1980s to 21 percent by 2016; Technology-intensive states, as well as those where women comprise a large percentage of the state’s overall workforce, show higher rates of women inventors; and Women are increasingly likely to patent on large, gender-mixed inventor teams, and are less likely than men to be an individual inventor on a granted patent.
Infrastructure
Report Finds more than 47,000 ‘Structurally Deficient’ Bridges in the U.S. (American Road & Transportation Builders Association). The length of America’s structurally deficient bridges if placed end-to-end would span nearly 1,100 miles, the distance between Chicago and Houston, a new examination of federal government data shows. The American Road & Transportation Builders Association (ARTBA) analysis of the recently released U.S. Department of Transportation 2018 National Bridge Inventory (NBI) database reveals 47,052 of America’s 616,087 bridges are “structurally deficient” and in poor condition. Cars, trucks and school buses cross these compromised structures 178 million times every day, the data show. Nearly 1,775 are on the Interstate Highway System. Bridges in poor condition pose a potential threat to lives and the flow of commerce. The ARTBA report provides state by state reports including the most traveled structurally deficient bridges by state.
Deal Makers
Incentives in Action
Why Do We Use Incentives? (Smart Incentives). We use incentives to achieve our community’s economic development goals. These goals may vary by location and even by incentive program, but might include promoting more or better jobs, helping businesses grow, increasing investment in our communities, revitalizing neighborhoods or redeveloping brownfield sites, and strengthening the tax base – among others. They key point here is that incentives should not be just about winning a deal. However, one of the biggest challenges we see is the lack of clearly defined economic development goals either overall or within incentive programs. There are big gains to be made without a huge expenditure of resources just by clarifying what the programs are trying to achieve.
Virgin Galactic is Finally Moving to New Mexico’s Spaceport (Washington Post). Richard Branson’s Virgin Galactic announced that after years of waiting and delays, it will finally move its operations to Spaceport America, the launch site in rural New Mexico that bills itself as the world’s first purpose-built commercial spaceport. For years the spaceport, which cost New Mexico taxpayers $220 million to build, waited for its anchor tenant to arrive. It stood as a symbol for the uncertain future of whether private companies would one day be able to fly ordinary people to space. Recently, the company finally reached its elusive goal when two test pilots flew SpaceShipTwo to an altitude of 51.4 miles, crossing the Federal Aviation Administration’s definition of space. Virgin Galactic will be shifting operations to Spaceport America near the southern New Mexico town of Truth or Consequences as it begins to prepare for commercial space tourism service later this year.
Michigan Business Development Program Offers Positive Returns and Good Practices (CREC & Upjohn Institute). The Michigan Business Development Program (MBDP) provides grants and loans to businesses for highly competitive projects in Michigan that create jobs and provide investment. The Michigan Economic Development Corporation (MEDC) engaged the Center for Regional Economic Competitiveness (CREC) and the W.E. Upjohn Institute for Employment Research to examine the MBDP to assess effectiveness. The study estimates that the MBDP has an ROI of 3.86. That is, for every $1 the state invests in the MBDP, the program results in a net gain of $3.86 in per capita income for Michigan residents. This ROI is higher than that for many other state incentive programs because: Michigan has targeted relatively high multiplier industries with an extensive network of local manufacturing suppliers that benefit when their incentivized customer grows; Michigan’s MBDP incentives are provided up-front, which increases cost-effectiveness because many businesses pay the most attention to near-term investment returns; and Michigan’s MBDP incentives are relatively modest in size, which increases effectiveness per dollar as incentives tend to experience declining returns as size increases.
The State Business Incentives Database is a national database maintained by the Council for Community and Economic Research (C2ER) with almost 2,000 programs listed and described from all U.S. states and territories. The Database gives economic developers, business development finance professionals, and economic researchers a one-stop resource for searching and comparing state incentive programs. To view the information available in the database, click here.
New Growth Opportunities
5G to Impact 20 Industries the Most (CB Insights). The next generation of 5G wireless technology could affect a wide range of industries, from healthcare to financial services to retail. Major 5G networks are expected to be deployed by 2020 and will transform many industries due to the technology’s ability to provide wider network coverage, more stable internet connections, and faster data transfer speeds. 5G will also enable the rise in the number of Internet of Things (IoT) devices, along with the amount of data they generate. From enabling remote robotic surgery and widespread adoption of autonomous cars to improving crop and livestock management, 5G is poised to disrupt a plethora of the world’s biggest industries. This report from CB Insights considers some of the potential industry impacts.
Talent Development/Attraction
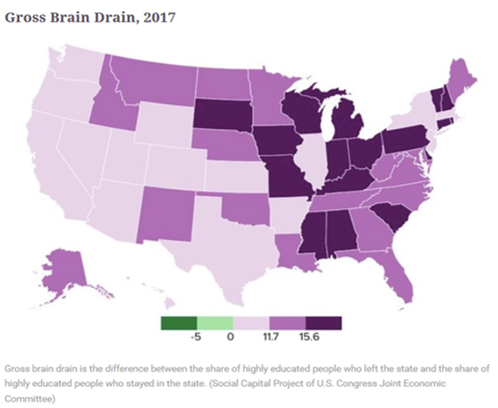
The Geography of Brain Drain in America (Route Fifty). Many studies have documented the growing divergence between places based on their ability to attract, retain, and cluster highly educated and skilled workers and to develop high-tech startup companies. A new report from the Social Capital Project of the Joint Economic Committee of the U.S. Congress takes a close look at the reality of brain drain across the 50 states. The report uses U.S. Census data and focuses on people in their post-college and post-graduate-school years—people between the ages of 31 and 40 who are either “movers” or “leavers,” heading off to different states, or “stayers” who continue to live in their home state. There is also an interactive map with all of the data points.
Opportunity Occupations (Federal Reserve Banks of Cleveland and Philadelphia). Opportunity employment, defined as employment accessible to workers without a bachelor’s degree and typically paying above the national annual median wage ($37,690), adjusted for regional differences in consumer prices, accounts for 21.6 percent of total employment in the 121 metro areas analyzed in the report. Some of the largest opportunity occupations, including a number in health care and the skilled trades, could experience above-average growth through 2026 and are not considered to be at significant risk of automation, while the reverse is true for some occupations in office and administrative support. Registered Nurses; Heavy and Tractor-Trailer Truck Drivers; Bookkeeping, Accounting, and Auditing Clerks; Maintenance and Repair Workers; and Carpenters are the largest opportunity occupations based on overall employment. Plumbers, Pipefitters, and Steamfitters; Registered Nurses; and Heating, Air Conditioning, and Refrigeration Mechanics and Installers are projected to be the fastest growing Opportunity Occupations in coming years.