Latest News
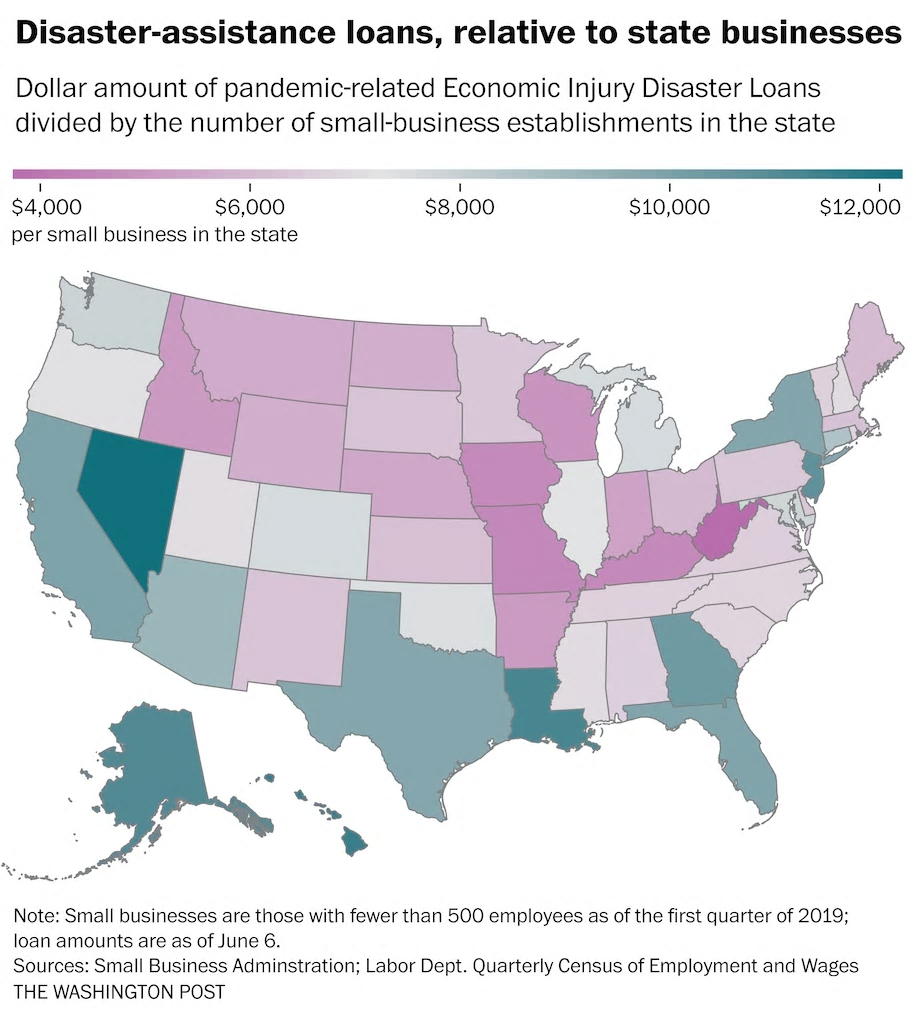
Where the Small Business Administration’s Coronavirus Disaster Loans are Going (Washington Post). About 40 percent of the SBA’s economic injury disaster loan (EIDL) program funding as of early June was captured by four states: California, New York, Florida, and Texas. A few states with relatively small economies received an outsize share of the disaster-loan funding after adjusting for the number of small businesses in the state. Meanwhile several states that were hit hard by the coronavirus received a relatively low amount of funding through EIDL, even after adjusting for the number of small businesses in the state. The SBA had approved just over 1.1 million coronavirus disaster loans, up from about 39,000 in late April. It has so far spent $80 billion out of about $365 billion in available loan funds. But the agency still has a long way to go toward addressing well over 5 million disaster-loan applications it received as the economic crisis set in. And questions linger about whether the loan funds — which are part of a separate program from the larger Paycheck Protection Program — are being distributed fairly and effectively.
* * *
– FYI –
COVID-19 State Legislation Database
The National Conference of State Legislatures maintains up-to-date, real-time information about bills related to and responding to COVID-19 that have been introduced in the 50 states and the District of Columbia. You can search legislation starting in 2020 by state, topic, keyword, year, status, primary sponsor, and with data visualizations. COVID-19 topics included in the database and the data visualizations include budgeting and revenue, child welfare, commerce, criminal justice, education, elections, employment, finance, health access and coverage, housing and homelessness, labor and retirement, legislative operations, public health, workforce and more. Bill information in the database and the visualization is updated daily.
* * *
State Economic Performance
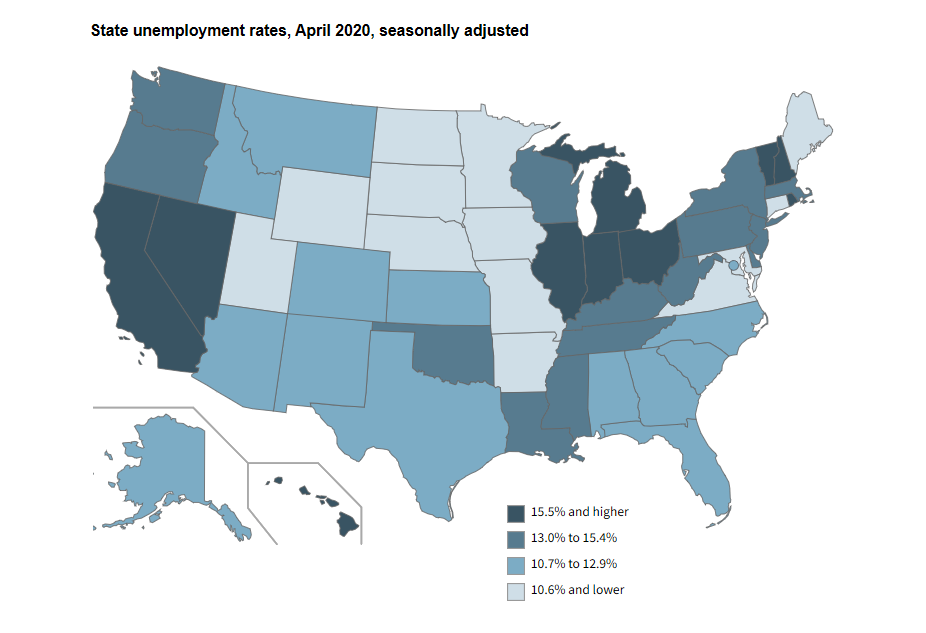
Historically High Unemployment Rates in 43 States (Bureau of Labor Statistics). Unemployment rates in 43 states were at their highest levels since the state unemployment data began in January 1976. Unemployment rates in Hawaii and Nevada exceeded their previous highs by more than 10.0 percentage points each, while the rates in Michigan, New Hampshire, Rhode Island, and Vermont exceeded their previous highs by more than 5.0 points each. In April 2020, Nevada had the highest unemployment rate (28.2 percent), followed by Michigan (22.7 percent), and Hawaii (22.3 percent). Connecticut had the lowest unemployment rate, 7.9 percent. The next lowest rates were in Minnesota (8.1 percent) and Nebraska (8.3 percent). The District of Columbia and 27 states had unemployment rates lower than the U.S. rate of 14.7 percent in April 2020, 10 states had higher rates, and 13 states had rates that were not appreciably different from that of the nation.
* * *
– Economic Outlook –
Federal Reserve Delivers Gloomy Economic Outlook
The Federal Reserve now projects the U.S. economy will shrink by 6.5% in 2020, that the unemployment rate will be 9.3% at the end of this year, and that interest rates are expected to remain near zero until the end of 2022. Chair Jerome Powell also stressed the limits of the Fed’s ability to help the economy, suggesting Congress needs to do more to aid workers who can’t get their jobs back and small-business owners who don’t make it through this pandemic through no fault of their own. “This is the biggest economic shock in the U.S., and in the world, really, in living memory,” Powell said in June’s FOMC Press Conference. “We went from the lowest level of unemployment in 50 years to the highest level in close to 90 years, and we did it in two months — extraordinary.”
* * *
Topics and Trends
Industry Watch
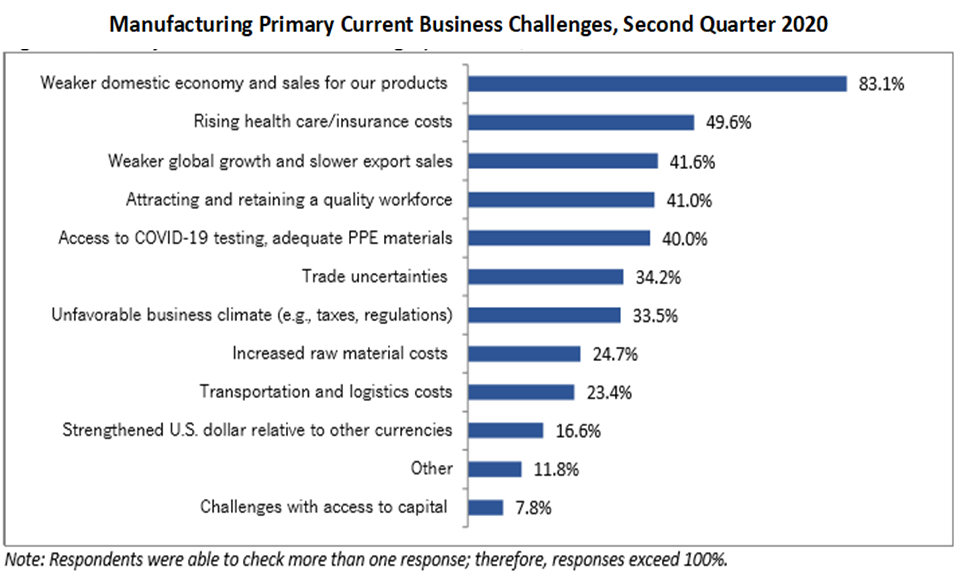
U.S. Manufacturing in Worst Contraction since the Great Recession (National Association of Manufacturers). Manufacturers have been severely challenged by demand and business disruptions due to the COVID-19 pandemic and the resulting recession. Production in the manufacturing sector fell 18.5% between February and April, while employment declined by at least 1.3 million. Against that difficult backdrop, the National Association of Manufacturers conducted the quarterly Manufacturers’ Outlook Survey in May. Despite finding levels of sentiment rivaling the Great Recession, the survey also found that operations continue at most manufacturing firms. In the second quarter of 2020, 33.9% of respondents reported a positive outlook for their company, the lowest reading since the first quarter of 2009 and down from 75.6% in the previous survey. Weak domestic demand was the top primary business challenge in the second quarter (83.1%), supplanting the inability to attract and retain talent (41%), which had been the top concern for 10 consecutive quarters. Although, 50.5% of manufacturing leaders anticipate that difficulties in attracting and retaining employees will continue to be a challenge over the next 12 to 18 months once the COVID-19 crisis abates. Overall, the data reflect a sector that is experiencing its worst contraction since the Great Recession.
Trade/Tariffs
U.S. Trade Is Key to Driving Africa’s Post-Coronavirus Recovery (U.S. News & World Report). U.S.-Africa trade relations have been governed for the past 20 years by the African Growth and Opportunity Act (AGOA), whose aim has been to stimulate investment in African manufacturing by giving qualified African countries – the majority – duty-free access to the U.S. market for virtually anything they can make, grow or extract from the ground, without our requiring reciprocal concessions. AGOA’s rules of origin have encouraged the development of regional value chains with some success, but not to the extent one might have hoped. AGOA expires in 2025. Meanwhile, the African Continental Free Trade Agreement (AfCFTA) represents the most far-reaching initiative yet undertaken to create an integrated African economy based on intra-continental value chains. Today, only 18% of Africa’s trade is with African countries. The aim is to make that 50% by 2030. The U.S. has much to gain from a well-crafted and successful AfCFTA as it encompasses a market of over a billion people. Moreover, an integrated Africa will be much better placed to resist pressures from China, the European Union and elsewhere to adopt policies that put U.S. firms at a disadvantage.
Opportunity Zones
Pandemic-Related Economic Struggles Could Increase Investment in Opportunity Zones (Novogradac). As the Opportunity Zone incentive nears its third birthday, there are some who expect the economic slowdown caused by the COVID-19 pandemic to increase the value of OZ investments. Since OZ investments are long-term investments and require at least 10 years to realize the full benefit, the COVID impact may be temporary on most if not all types of investment. OZs can be a counter-cyclical investment option that works well in a down market. One area that may be ripe for investment is OZ businesses. For an investor right now, most opportunities, structures and funds have a real estate focus. “Real estate has a cap in rent you can charge, so it’s very unlikely for funds to have more than a two- to four-times multiple over 10 years. That’s not the case for operating businesses,” said Steve Glickman, founder and CEO of Develop LLC. “This is a very interesting time to buy or invest in a distressed company…I expect OZ business investing to be extremely effective.” Another major factor is that the IRS extended the 180-day deadline to invest capital gains for all taxpayers who faced a deadline of April 1 through July 14. They all now have a deadline of July 15. This potentially adds to the number of OZ investments already expected for this summer.To view the Final Regulations on Opportunity Zones issued by the U.S. Treasury Department and IRS, click here.
Opportunity Zone Bill Helps Companies that Missed PPP Funds (Law360). A proposal to allow small businesses affected by COVID-19 to qualify for opportunity zone investments could shore up the finances of companies that missed Paycheck Protection Program funds. Reps. John Curtis, R-Utah, and Henry Cuellar, D-Texas, introduced the Small Business Opportunity Zone Act, which would allow small businesses affected by the novel coronavirus pandemic to be classified as a qualifying businesses in which investors can receive favorable opportunity zone tax benefits. The legislation is meant to create a new incentive to encourage investments in smaller companies that have been impacted by COVID-19 through supply chain disruptions, staffing changes, decreases in sales or customers, or a partial or full suspension of business. The measure may dovetail well with the Paycheck Protection Program, which provided billions in loans to small businesses, but for which money has quickly run out, resulting in many companies not receiving financial assistance. For more information on Opportunity Zones, CDFA has extensive resources available, click here.
The Opportunity Zones program provides a tax incentive for investors to re-invest their unrealized capital gains into Opportunity Funds that are dedicated to investing into Opportunity Zones designated by the chief executives of every U.S. state and territory. Treasury has certified more than 8,700 census tracts as Qualified Opportunity Zones (QOZs) across all states, territories, and the District of Columbia. For a map of all designated QOZs, click here.
Inclusive Growth
Increasing Equity: The Potential for Growing Worker Ownership (Aspen Institute). Companies can share economic success through various models. Employee Stock Ownership Plans (ESOPs), worker cooperatives, profit sharing, and forms of equity participation all present different opportunities to share that success. Employee-owned firms have also shown strong resilience through economic downturns and often use management approaches that lead to higher-quality jobs. ESOPs currently cover about 11 million employees in just over 6,000 companies with the total value of employee shares ownership — before the crisis— of $1.4 trillion with employee owned assets per employee of $130,000. Recent approaches to employee ownership emphasize two positive features for modest income workers: first, the chance to build some capital and wealth in addition to fair wages; and second, the opportunity to more fully participate in the workplace where you work. This is the sixth webinar in Aspen Institute’s Job Quality in Practice series. The webinar series is designed to support practitioners across fields – including workforce development, economic development, capital deployment, policy, worker advocacy, and business – to address job quality with actionable tools and approaches.
Innovation
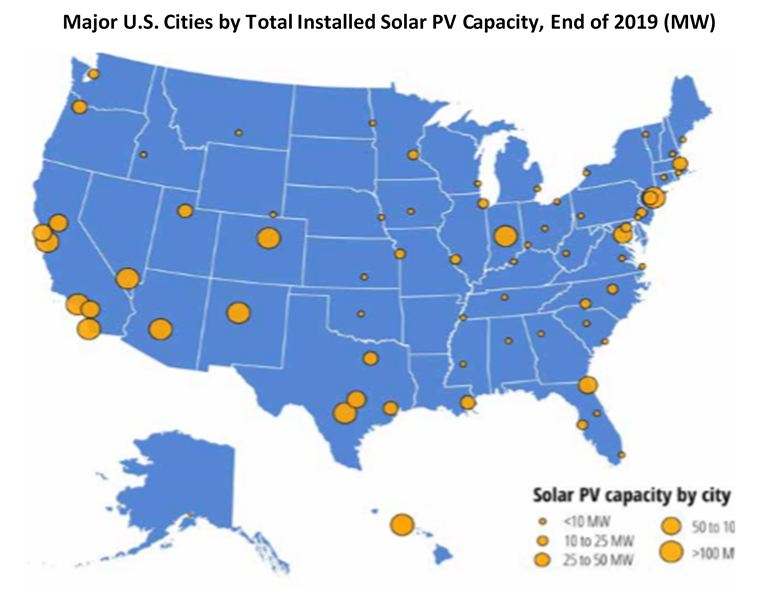
Shining Cities 2020: Top U.S. Cities for Solar Energy (Environment Texas). Solar power is expanding rapidly. The United States now has 77.7 gigawatts (GW) of solar photovoltaic (PV) capacity installed – more than enough to power one in every 10 homes in America. Hundreds of thousands of Americans have invested in solar energy and millions more are ready to join them. America’s major cities have played a key role in the clean energy revolution and stand to reap tremendous benefits from solar energy. As population centers, they are major sources of electricity demand and, with millions of rooftops suitable for solar panels, they have the potential to be major sources of clean energy production as well. Of the 57 cities surveyed, almost 90 percent more than doubled their total installed solar PV capacity between 2013 and 2019. Honolulu leads the United States for solar power per person among cities surveyed, followed by San Diego, Albuquerque, and San Jose. However, leading solar cities can be found in every region of the country.
Infrastructure
Water Infrastructure Investments Important to Regional Economic Development (Appalachian Regional Commission). A new evaluation of the Appalachian Regional Commission’s drinking water and wastewater investments found that these strategic investments contribute to significant positive economic growth and development across the Region. Conducted by the University of North Carolina at Chapel Hill Environmental Finance Center (EFC) and the Virginia Polytechnic Institute and State University (Virginia Tech), the analysis concluded that ARC’s nearly 400 water and wastewater investments benefited 17,400 businesses, created 11,700 jobs, retained 22,000 jobs, and leveraged an additional $3.8 billion in private sector investments. Moreover, two-thirds of ARC’s investments in water and wastewater made between FY 2009-2016 were awarded to communities in areas and counties labeled as “distressed.” The report findings show the grant portfolio successfully targeted the neediest locations, led to significant improvements in local economic conditions, and met or surpassed locally determined performance goals.
* Check out the SEDE Website *
The SEDE Network engages in regular activities and events throughout the year. You can stay up to date on all these activities via the SEDE Network website. The newest addition to the site includes a collection of websites and other communication resources used by states to address the Coronavirus Challenge.
Click the link above and check it out!
Deal Makers
Incentives in Action
New Jersey Expands Micro Business Loan Program (NJEDA). The New Jersey Economic Development Authority (NJEDA) announced an expansion of its Micro Business Loan Program to assist state small businesses, many of which are facing business interruption from COVID-19. The expanded program will provide financing up to $50,000 for micro businesses and nonprofits with ten or fewer employees and no greater than $1.5 million in annual revenues. The NJEDA launched the Micro Business Loan Program in November 2019. The expanded program will provide financing for inventory, equipment, and working capital. Loans will have a standard ten-year term with interest rates set at 2 percent, and with no interest and no payment due for the first three years. Businesses that receive financing under the enhanced program and are still in operation 12 months after the closing date of the loan will have ten percent of the approved loan amount forgiven. The NJEDA will capitalize the program with $10 million, with $3.5 million set aside to support eligible entities located in New Jersey Opportunity Zone-eligible census tracts.
Missouri Launches New Economic Recovery Dashboard (Missouri Department of Economic Development). Missouri announced the launch of a new Economic Recovery dashboard to help track the state’s economic recovery. “In the economy, we’re starting to see early signs of recovery,” Director for Economic Development Rob Dixon said. “Data driven decision making is a core value of our department and it is crucial that other leaders use this data to revitalize our economy and get Missourians back to work.” The Show Me Strong Economic Recovery Dashboard tracks metrics across multiple categories impacting businesses, communities, and citizens. Among the signs of recovery monitored by the dashboard: Only 5 percent of state small businesses were seeing increases in revenue at the end of April. The latest data has climbed to more than 15 percent. Credit and debit card consumer spending by Missourians has rebounded to within 5 percent of January levels, and the data also shows strong upticks in job postings in some of the hardest hit industries like leisure and hospitality.
The State Business Incentives Database is a national database maintained by the Council for Community and Economic Research (C2ER) with almost 2,000 programs listed and described from all U.S. states and territories. The Database gives economic developers, business development finance professionals, and economic researchers a one-stop resource for searching and comparing state incentive programs. To view the information available in the database, click here.
New Growth Opportunities
Mid-Size Markets Competing for Business and Winning (Area Development). Along with the transformation and diversification of the American economy, we’ve also witnessed a shift of businesses that are not solely focused on the largest urban centers, but also considering major investments and significant job-creation projects in cities considered to be in the “mid-sized” range, defined as markets with a population above 150,000 and below one million. Business leaders are now recognizing that core location drivers, especially workforce and operational cost savings, can be achieved in these next-tier communities. For nearly all strategic location decisions today, the most important factor to evaluate is workforce. Mid-size U.S. markets are often well-positioned with a robust talent pipeline, many times rivaling that of their larger competitors. The primary reasons for this are the presence of good school systems, major universities, and other institutions of higher education. Mid-size markets are also attracting businesses because of the support of local political leadership and economic development officials to establish strong public-private partnerships with the business community. Partnerships can come in many shapes and forms, including economic incentives, skill development programs, zoning and permitting considerations, and infrastructure support, among a list of others.

Talent Development/Attraction
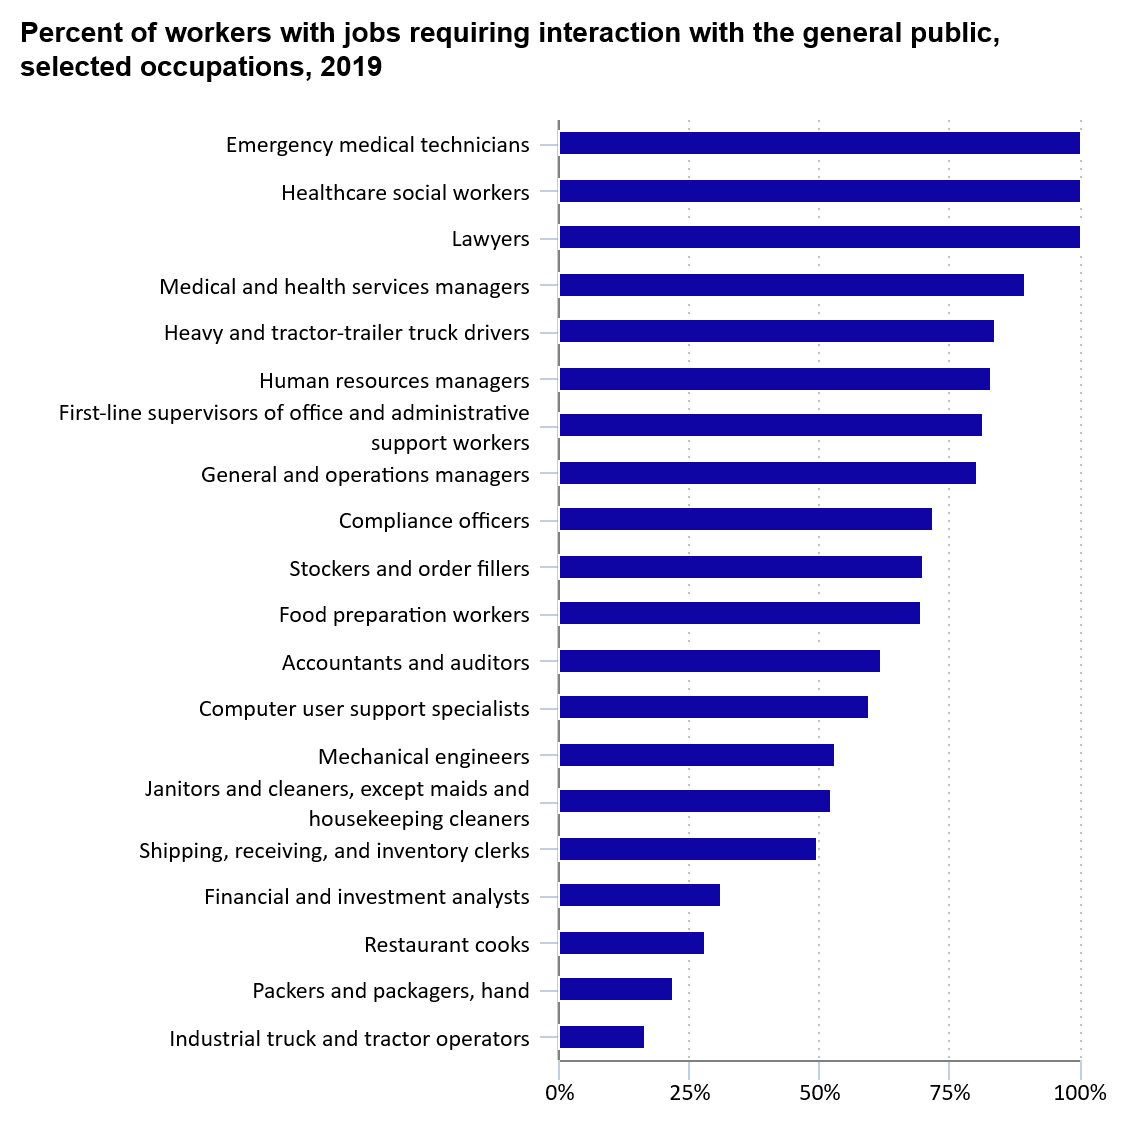
Three-Fourths of Workers Must Interact with the Public (Bureau of Labor Statistics). Three-fourths of workers (75.3 percent) were required to interact with the “general public” (public). Interacting with the public includes working with people other than coworkers, having large numbers of people rotating in and out on a regular basis, and conducting in-person or telephone contacts. It does not count any interaction as interacting with the public, nor does it include indirect contacts such as email. Based on this definition, one hundred percent of lawyers, healthcare social workers, and emergency medical technicians were required to interact with the public. Working around “crowds” occurs when a job meets all of the following conditions: many unfamiliar people are present, compared with the space available; movement is restricted; the arrangement of the crowd is temporary; there is a certain level of disorganization; and workers are not separated from unfamiliar people by counters, dividers, or other objects. Less than 5 percent of workers were required to work around crowds. Police and guards, firefighters, and waiters and waitresses most often work in crowds.
* * *
– SEDE Network Discussion –
The COVID Crisis Impact on Working Families
Elizabeth Ananat, professor of economics at Barnard College and Columbia University, joined the weekly SEDE COVID Response call to discuss her research and recent New York Times Op-ed on the crisis’ impact on working families. Her research found that as the coronavirus crisis has intensified, low wage working families immediately experienced drastically reduced work hours and layoffs. The economic and psychological consequences for families have been severe. Although employer-provided supports have helped some families maintain income, these efforts reach fewer than half of families, and the broad set of public policies that were immediately enacted have reached even fewer. Vulnerable families’ circumstances will only worsen unless efforts to reach them greatly intensify immediately.
* * *
Delivering Workforce System Services Remotely (National Governors Association). Across the United States, American Job Centers (AJCs) provide a range of assistance to jobseekers, students, and businesses. Due to COVID-19, they have had to readjust their delivery methods. It is critical that AJCs continue to operate during COVID-19, because of the rise in unemployment and the growing need to provide employment and training services to unemployed and underemployed individuals. To do so, many states found innovative ways to offer program and service delivery and are providing online and remote options for training, referrals, career counseling, job listings, and other employment-related services. Governors, state agencies and private partnerships play important support roles for increasing AJCs’ ability to create a remote service delivery system that meets the needs of job seekers, students, and businesses. This memo outlines strategies governors and states can implement to deliver workforce system employment and training services remotely.
* * *
SEDE Network Updates
* Upcoming SEDE Event *

U.S. / UK Trade Briefing Session and Discussion
With the UK Minister of State for Trade Policy, Rt Hon Greg Hands MP
Tuesday, June 30, 2020
11:30 – 12:30 EDT
Please contact John Snider (John.Snider@Commerce.RI.gov)
if you would like to participate.
* * *
The SEDE Network Steering Committee includes: Stefan Pryor (RI), Chair; Val Hale (UT), Vice Chair; Julie Anderson (AK); Dennis Davin (PA); Jennifer Fletcher (SC); Kurt Foreman (DE); Joan Goldstein (VT); Manuel Laboy Rivera (PR); Kevin McKinnon (MN); Don Pierson (LA); Mike Preston (AR); Sandra Watson (AZ).
For further questions on the content in this Bulletin or for information on the SEDE Network contact Marty Romitti, CREC Senior Vice President, at mromitti@crec.net