Latest News
What the Experts See Coming in 2020 (Visual Capitalist). In the modern era, data and media are the new magic 8-ball. The jury is still out on whether we’ve gotten any better at anticipating the forces that will shape the coming year, but that certainly hasn’t stopped people from trying. Of the hundreds of forward-looking pieces of content published in the lead-up to 2020, how many of the expert predictions lined up? Was there a consensus on any trends, or were predictions all over the map? During the month of December Visual Capitalist analyzed over 100 articles, whitepapers, and interviews to answer that question. While there was no firm consensus on where 2020 will take us, there were a few themes that appeared in multiple publications. The graphic below highlights the reappearing predictions.

State Economic Performance
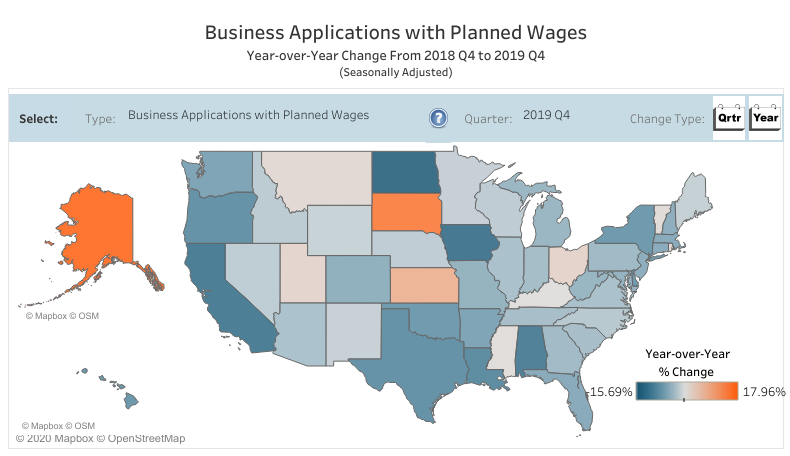
Business Formation Statistics by State (U.S. Census Bureau). Overall, the U.S. received 114,969 business applications with planned wages in 2019 Q4. This was a 6.9% decrease from 2018 Q4. Business Formation Statistics (BFS) are a product of the U.S. Census Bureau developed in research collaboration with economists affiliated with Board of Governors of the Federal Reserve System, Federal Reserve Bank of Atlanta, University of Maryland, and University of Notre Dame. The BFS provide timely and high frequency information on new business applications and formations in the United States. This includes business applications as indicated by applications for an Employer Identification Number (EIN), actual and projected business formations originating from business applications based on the record of first payroll tax liability for an EIN, and the delay in business formation as indicated by the average duration between business application and business formation nationwide and individual states.
Topics and Trends
Industry Watch
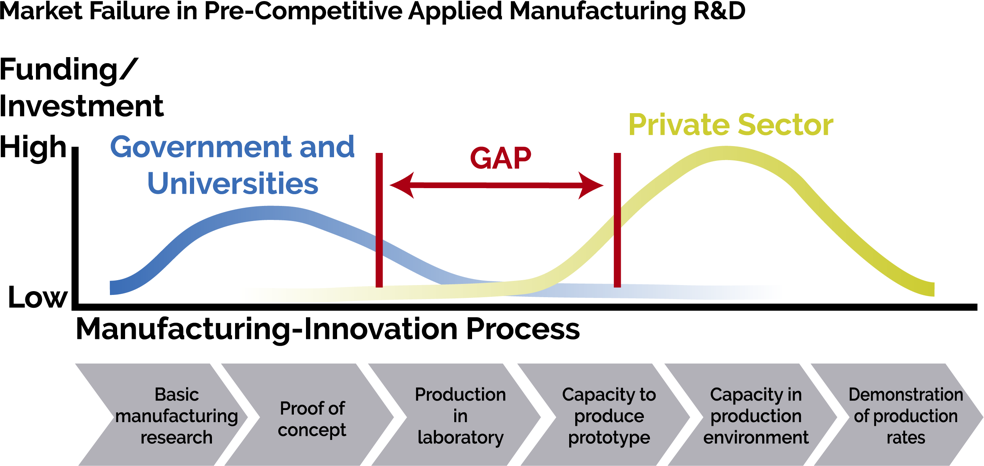
Bridging the ‘Valley of Death’ for U.S. Biomanufacturing (National Institute of Standards & Technology). Biopharmaceutical manufacturing uses living cells to produce therapies that treat diseases like cancer, diabetes and autoimmune disorders. Manufacturing medicine using biology presents different challenges from the traditional chemical manufacturing processes that stamp out identical pressed pills. Biomanufacturing processes are hard to control, and the products are difficult to define as “identical” from batch to batch. Despite these challenges, biopharmaceuticals are critical to public health because the advantages are significantly greater. Scientific understanding of diseases and the success of biologically manufactured therapies to treat them has increased dramatically. But it can take a decade from design to full production of a biopharmaceutical — not fast enough to meet the needs of all the patients, or to beat competition from overseas. The U.S. leads the world in innovations and inventions, yet the manufacturing capabilities and new products are often “stranded in the lab,” or get developed in other countries. It is important to ensure that American innovations get made in America, so more must be done to resolve biopharma’s “Missing Middle.”
Trade/Tariffs
China says the ‘Trade War is Not Over Yet’ with Phase-One Deal (Markets Insider). Chinese state media reiterated Monday that an interim trade agreement wouldn’t mark the end of its tit-for-tat economic dispute with the US, underscoring key issues that have been left unresolved between the two sides. The US and China completed a so-called phase-one agreement. As part of that deal, the US will lower a portion of tariffs against China in exchange for increased market access for international finance firms, stricter rules around intellectual property and currency movements, and agricultural purchases. The phase-one agreement has been widely cheered by companies and investors who have increasingly complained that the dispute has raised costs and cast uncertainty on business plans. But it left out some of the most complex issues the US cited in the Section 301 investigation that initially led to escalations in early 2018, including the large-scale subsidies and cheap loans awarded to Chinese businesses by the government. American officials and executives have long argued that practice has put domestic companies at a disadvantage in the global market. To view the Phase One Economic and Trade Agreement Between the U.S. and China, click here.
Effects of 2018-2019 Tariffs on a Globally Connected U.S. Manufacturing Sector (Federal Reserve Board). This paper from the Federal Reserve examines the effect of the tariff increases imposed by the United States and its trading partners in 2018 on outcomes in the U.S. manufacturing sector. It calculates measures of each industry’s exposure to tariff changes via three channels: the import protection that comes when an industry’s output is subject to U.S. tariffs, the increase in production costs resulting from tariffs on imported inputs, and the reduction in foreign competitiveness due to retaliatory tariffs in U.S. export markets. It then estimates the relationship between these measures of exposure to tariffs and manufacturing employment, output, and producer prices. The Federal Reserve researchers find that the tariffs are associated with relative reductions in manufacturing employment and relative increases in producer prices. For manufacturing employment, a small boost from the import protection effect of tariffs is more than offset by larger drags from the effects of rising input costs and retaliatory tariffs. For producer prices, the effect of tariffs is mediated solely through rising input costs. The results suggest that the traditional use of trade policy as a tool for the protection and promotion of domestic manufacturing is complicated by the presence of globally interconnected supply chains.
Opportunity Zones
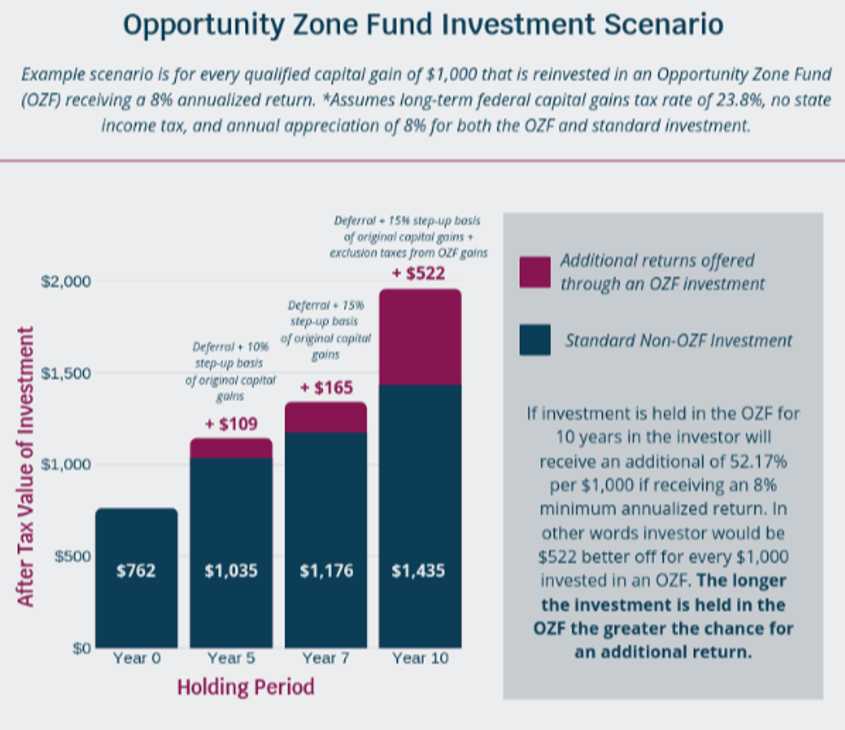
IRS Publishes Final Opportunity Zone Regulations (Forbes). The U.S. Department of Treasury released the long-awaited final Opportunity Zone Treasury Regulations. The Final Regulations and explanatory materials span 544 pages and give some needed clarity into how the Opportunity Zone tax rules work. Treasury has issued two prior sets of proposed regulations. The Final Regulations consolidate these proposed regulations as well as change various parts to reflect comments received on the rules over the last two years. Among the changes that were made, the Final Regulations clarify aspects of the 180-day investment period, clarify how the substantial improvement test is met, changed the rules relating to the purchase and development of vacant property, expanded the working capital safe harbor for start-up businesses, and provided a de minimis exception for “sin” businesses. The deadlines under the program have not changed. In order to be eligible for the full 15 percent exclusion from income of the deferred capital gains, an investment in a QOF must have been made by December 31, 2019. The exclusion now drops to 10 percent provided the investment is held for at least five years prior to December 31, 2026. To view the Final Regulations on Opportunity Zones issued by the U.S. Treasury Department and IRS, click here.
Opportunity Zones: The Complete Guide (The Motley Fool). There are currently 8,700 opportunity zones in both rural and urban areas throughout the country, with OZs in every state and territory. Over 35 million people reside in the designated OZs. As a whole opportunity zones have an average poverty rate of 29% and troubled real estate markets. In the past decade they’ve seen a sluggish overall economic progress and a decline in population. While these areas are some of the most underserved communities of the country, there is an opportunity for revitalization. The zones currently have 379 colleges or universities, 479 airports, 475 solar energy installations, 127 wind farms, 15 battery plants in the zones, 24 million jobs, and 1.6 million businesses. The influx of capital is an opportunity to help established businesses grow and expand while also bringing new measures for economic growth. This comprehensive guide explains what an opportunity zone is, how they work, and why they are attractive to real estate investors. For more information on Opportunity Zones, CDFA has extensive resources available, click here.
Opportunity Zones ‘Full Steam Ahead’ After Final Rules Debut (Bisnow Los Angeles). For the past several months, after the launch of his opportunity zone fund, Avanath Capital CEO and founder Daryl Carter had approached investors to invest in his project, only to hear a common word: “Wait.” Last year, with so many questions and so much uncertainty surrounding the opportunity zone program, many investors sat on their hands waiting for the IRS and the Department of Treasury to answer some much-needed questions before releasing capital. But with the release of the third and final set of guidelines in mid-December, Carter believes many of those wait-and-see investors are going to start putting money into opportunity zones. As part of Carter’s opportunity zone fund, he plans to rehab a couple of existing apartments in his portfolio that are in opportunity zones and add more units on an adjacent vacant lot. Carter launched a qualified opportunity zone fund with a target of raising $300M that would go toward the improvements and renovations of three existing multifamily properties, one each in Ontario, California; Orlando, Florida; and Cary, North Carolina; as well as for the development of a property in Detroit. The IRS and the Treasury Department will now allow an opportunity zone investor to aggregate certain buildings on the same parcel as a single property, as long as it is in the same opportunity zone fund and it shares certain facilities and business elements.
The Opportunity Zones program provides a tax incentive for investors to re-invest their unrealized capital gains into Opportunity Funds that are dedicated to investing into Opportunity Zones designated by the chief executives of every U.S. state and territory. Treasury has certified more than 8,700 census tracts as Qualified Opportunity Zones (QOZs) across all states, territories, and the District of Columbia. For a map of all designated QOZs, click here.
Inclusive Growth
Developing Affordable Housing Isn’t Easy (Public Source). Affordable housing depends on federal tax credits. Securing them is a complex, competitive process. Oakland Affordable Living, a 49-unit complex, opened in 2018 to help stabilize housing prices in the neighborhood. The complex was financed with low-income housing tax credits [LIHTC]. A federal program managed by state agencies, LIHTC is the financial skeleton key that unlocks most of the affordable rental housing developed in the United States. Without this crucial funding, the Oakland Planning and Development Corporation [OPDC] would not have been able to finance the $16.3 million project. In simple terms, LIHTC enables developers to turn federal tax credits into homes for low-income families. Developers sell their tax credits to an investor, such as a bank, that provides an upfront construction loan. In exchange, the investor gets a 10-year tax reduction, roughly equal to the loan amount. The project illustrates the power of LIHTC to produce high-quality housing and support families as rents rise. But it also reveals LIHTC’s limitations to address a nationwide housing crisis.
Infrastructure
A Framework for Making Better Infrastructure Decisions (McKinsey & Company). Infrastructure—like transportation, power, water, and telecom systems—underpins economic activity and catalyzes growth and development. The world spends more than $2.5 trillion a year on infrastructure, but $3.7 trillion a year will be needed through 2035 just to keep pace with projected GDP growth. National, state, and local governments are devoting increased amounts of capital to meet these needs, and for good reason. The McKinsey Global Institute estimates that infrastructure has a socioeconomic rate of return around 20 percent. In other words, $1 of infrastructure investment can raise GDP by 20 cents in the long run. Gains from infrastructure are fully realized, however, only when projects generate tangible public benefits. Four best practices depicted below can help governments improve and modernize decision making for infrastructure. By approaching infrastructure projects in this way, a government can improve not only their selection but also their outcome.

Innovation
Consumer Electronics Show 2020: The Future of Cities, Transportation and Equity (Government Technology). Making smart city design citizen centric — with an eye toward security and inclusion — has been a big theme at this year’s Consumer Electronics Show (CES) in Las Vegas. The annual electronics conference gives corporate and government insiders a chance to look at future trends in tech, but also to discuss how it can be paired with policy to improve citizens’ lives. A number of events at CES this year highlighted the importance of transportation, not the least of which was the keynote given by U.S. Transportation Secretary Elaine Chao, who unveiled a new set of federal guidelines designed to pave the way for safe and efficient private development of autonomous vehicles. Paired with Chao’s announcement were AV models from Audi, Honda, Bertrand and many other car makers. The transportation options of the future won’t just involve driving cars, however, but also flying ones. This year, Hyundai showcased its partnership with Uber to create the “flying taxi,” or the S-A1. Bell, meanwhile, made a similar move in showing off its new Nexus 4EX, a flying car that is also a partial hybrid vehicle.

Deal Makers
Incentives in Action
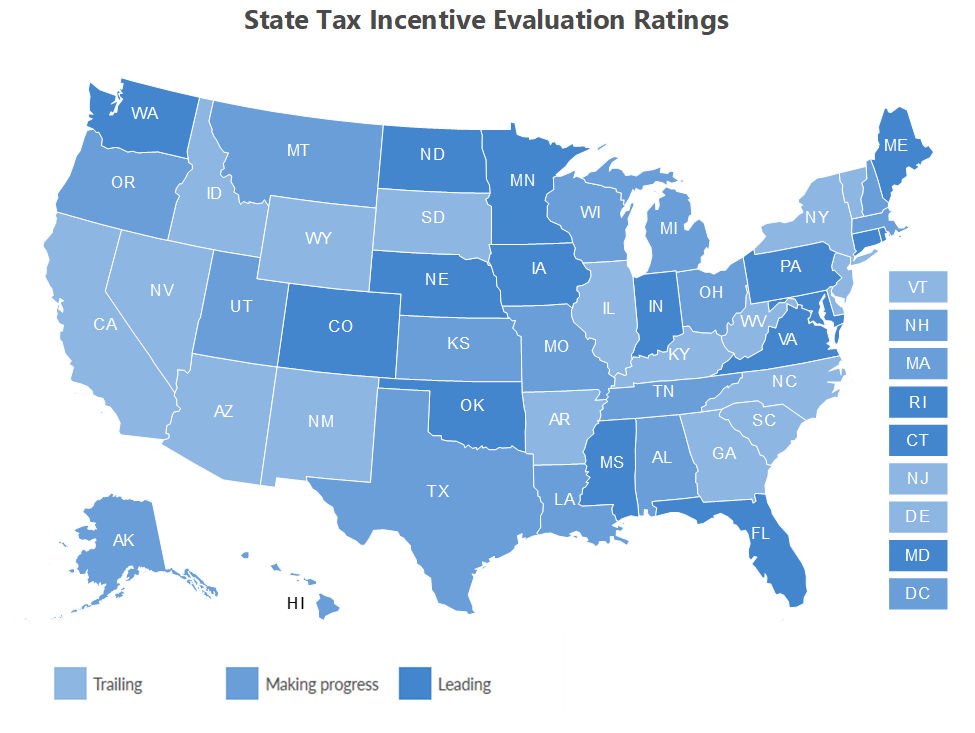
Governments Increasingly Rely on Evaluations for Tax Incentive Reform (Pew Charitable Trusts). A growing number of state and local governments are regularly evaluating the effectiveness of their economic development tax incentives and considering whether these programs are worth the cost. In 2019, Kansas and Montana joined the nearly two-thirds of states that require rigorous evaluation processes. Evaluations offer evidence to help states and cities make informed decisions about incentives that can lead to improvements in program performance. Incentive reviews also can identify issues involving unclear or confusing program guidelines or highlight unused or ineffective programs. In addition to altering or eliminating existing programs, policymakers can use the evaluation process to develop new strategies for bolstering state economic development tools.
Georgia’s Film and TV incentives Could Become Part of a 2020 Budget Battle (Atlanta Journal Constitution). Georgia’s generous tax credits to film and TV production companies have sparked a billion-dollar studio boom here. This is a solid fact. The question now is whether the financial lure will remain a sacred cow in a season of widespread cuts to the state budget. The tax credits, which grew from $141 million in 2010 to an estimated $870 million in 2019, have been a policy mainstay. The credits amount to roughly 3% of the current state budget. The governor has called for a 4% cut in many areas for this year and 6% in cuts for next year. The state’s film and TV tax credit system has two unique features. First, there is no cap. Second, the tax credits are transferable. Let us suppose that a film company spends $3,333,333 in Georgia and meets all the necessary state criteria — which include putting that Georgia peach at the end of the movie — they earn a 30% tax credit worth $1 million. But the film company isn’t based in Georgia, and so its tax obligations to the state are minimal. The film company can sell that tax credit — for cash — to any entity that owes state taxes, whether it produces widgets, okra, carpets or nothing at all.
Large Incentive Deals Don’t Spur Growth at State and Local Level (Journal of Economic Perspectives). Large incentive packages targeted at individual companies don’t seem to spur broader economic growth at the state and local level, according to a new research paper. The study — co-authored by Columbia and Princeton economists — questions the use of incentives to lure or retain businesses, a practice that has tripled in size across the U.S. since the 1990s. While the authors find some evidence of direct employment gains from attracting a firm via incentives, they do not find strong evidence that firm-specific tax incentives increase broader economic growth at the state and local level. The research documents an average growth of roughly 1,500 jobs within the specific industry of each deal but doesn’t find strong evidence of job growth in other industries or an effect on county-wide employment. The study argues state and local business tax incentives must better demonstrate that these policies improve equity, either by improving economic conditions in the most distressed places or by improving the well-being of underemployed and low-income workers.
The State Business Incentives Database is a national database maintained by the Council for Community and Economic Research (C2ER) with almost 2,000 programs listed and described from all U.S. states and territories. The Database gives economic developers, business development finance professionals, and economic researchers a one-stop resource for searching and comparing state incentive programs. To view the information available in the database, click here.
New Growth Opportunities
Apple is Trying to Change the Way Electronics are Recycled (Reuters). Inside a nondescript warehouse on the outskirts of Austin, Texas, Apple’s Daisy robot breaks apart iPhones so that 14 minerals, including lithium, can be extracted and recycled. Apple is already using recycled tin, cobalt and rare earths in some of its products, with plans to add to that list. The company recently bought the first commercial batch of carbon-free aluminum from a joint venture between Rio Tinto and Alcoa. The Daisy robot is part of its plan to become a “closed-loop” manufacturer that does not rely on the mining industry, an aggressive goal that some industry analysts have said is impossible. Many mining executives note that with the rising popularity of electric vehicles, newly mined minerals will be needed on an even larger scale, a reality that Apple acknowledges.
Talent Development/Attraction
ROI of Liberal Arts Colleges: Value Adds Up Over Time (Georgetown Center on Education and the Workforce). The value of a liberal arts education has come into question as more students are opting for undergraduate degrees with direct connections to the job market. In response to demand, some liberal arts colleges have cut programs in traditional liberal arts fields and created programs in career-oriented fields like business. Despite these efforts to attract more students, some small liberal arts colleges have closed or are in danger of closing. Given these challenges, it is worth asking: How do students who attend the 210 or so liberal arts colleges in the United States fare financially once they enter the labor force? It turns out they fare quite well. These colleges’ median return on investment (ROI) 40 years after enrollment is $918,000. That puts the ROI at these colleges just below the ROI at universities with the two highest levels of research activity. The report notes the ROIs of most four-year institutions typically lag those of two-year institutions in the short term because it takes longer for students to earn a bachelor’s degree before they enter the workforce and begin earning money. At the 40-year mark, the value of the credential is more evident.
The Workforce of 2020 and 3 Things to Expect (Inc.). Today, leaders often discuss the war for talent. This war is only expected to grow worse. As the dawn of a new decade takes over, there will be a not so new force to be reckoned with in the workforce…Millennials. According to a recent study, in 2020 millennials will make up 50 percent of the US workforce while Gen Z, who have recently been garnering a lot of attention will make up 7 percent; giving this next gen talent combo a tremendous amount of influence. While there has been much discussion around millennials and Gen Z’s and their influence, it is ironic that most organizations have struggled to figure out how to effectively recruit, engage and retain next generation talent. These failures are going to create a major problem for individual organizations and the US economy in the coming decade.
The SEDE Network Steering Committee includes: Stefan Pryor (RI), Chair; Val Hale (UT), Vice Chair; Julie Anderson (AK); Dennis Davin (PA); Jennifer Fletcher (SC); Kurt Foreman (DE); Joan Goldstein (VT); Manuel Laboy Rivera (PR); Jeff Mason (MI); Kevin McKinnon (MN); Don Pierson (LA); Mike Preston (AR); Sandra Watson (AZ).
For further questions on the content in this Bulletin or for information on the SEDE Network contact Marty Romitti, CREC Senior Vice President, at mromitti@crec.net