Category: Blog Post

  • Strengthening Partnerships: Improving the Alignment Between States and Economic Development Districts

    | October 18, 2022 |

    The 2022 National Association of Development Organization’s (NADO) Annual Training Conference held in Pittsburgh offered more than 400 attendees a strong training agenda including sessions to help economic development districts (EDDs) enhance their relationship and collaboration with state economic development partners.
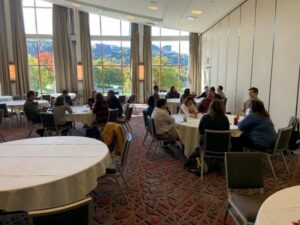
     

    The Center for Regional Economic Competitiveness (CREC) convened a Technical Assistance (TA) Learning Lab, a panel workshop and one-on-one TA sessions with several EDDs all aimed at helping EDDs work with their state partners. The sessions focused on the alignment of state-economic development district (EDD) strategies, exploration of emerging practices, and how to build a collaborative relationship with state economic development departments – from planning to program implementation. A separate conference session on the importance of state EDD associations also offered important insights into strategic alignment.


    At the October 16th Learning Lab, 30 attendees heard Mereb Hagos, Program Manager at CREC, share an overview of CREC’s project with EDA to better align state and local economic development planning strategies and discussed research findings from the state-local economic development strategies matrix and emerging practices. Following the presentation, CREC and NADO facilitated small group discussions with EDD leaders on four key topics:

    1) Opportunities for EDD and state collaboration,

    2) Examples of where state-local collaboration is happening,

    3) Obstacles for collaboration, and

    4) EDD involvement in the planning/execution of the EDA $1 million Statewide Planning Grants.


    The session was lively with good small group discussions that provided some key takeaways and opportunities to strengthen the coordination between state, regional and local economic development offices, including:

    • Examples of Collaboration: Economic development districts are collaborating with their respective states on broadband infrastructure development, regional transportation infrastructure, business lending programs, export marketing, CEDS development, and recovery/resiliency planning.
    • Obstacles: Some EDD representatives reported experiencing turf battles, where some states view EDDs as competitors over subject and policy areas, funding and resources, and status. EDDs also recognize that it can be difficult for states to know when to interact with the EDDs when there are varying perspectives of EDD strengths and differences in priorities. EDDs also noted that they deal with constant staff turnover at both their organizations and at legislative offices, making it sometimes difficult to forge strong collaborative relationships. EDDs are also not always aware of community federal applications and would benefit from additional transparency in the federal application process.
    • Opportunities: EDDs play a vital role in economic development and can actively demonstrate their value to state representatives by providing fees for services, such as providing local data analyses. EDDs can fill gaps for capacity needs and be a resource for small communities as they work to address their regional challenges. EDDs can also advocate for EDA reauthorization to provide stability in their programming.
    • $1 Million Statewide Planning Grants: Almost all EDDs indicated they were not aware of the EDA $1 million Statewide Planning Grant and have not been engaged by their respective states to participate in the planning process. One attendee noted that their Economic Development Representative strongly encouraged their state to engage with districts on broadband and developing the statewide CEDS.

    The Learning Lab session was extremely insightful for economic development district leaders to learn from their peers and energize their interest to engage their states through the CEDS planning process and the $1 million Statewide Planning Grants.

    EDDs and States:  Collaborating for Success

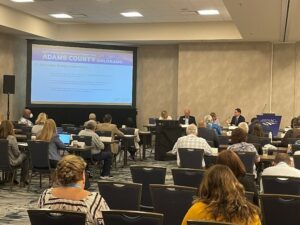
    An October 17th session at the conference featured Mereb Hagos, Cindy Hultz and Caroline Smith.  Mereb is a Program Manager with CREC, and she presented background on how the Pennsylvania Department of Community & Economic Development works with economic development districts in Pennsylvania. Cindy is the Executive Director of the Mark Twain Regional Council of Governments (Perry, MO) and Carolina is the Economic Development Manager for the Apalachee Regional Planning Council (Tallahassee, FL). Both presented unique examples of specific collaboration between their regional governments and respective states.

    The session also featured live polling where the audience responded to specific questions about alignment and collaboration with their states. The questions and response highlights are below:


    • How would you rate your EDD’s strategic alignment with your state’s economic development department? About 60% of the respondents indicated that their EDD’s strategic alignment was “poor” or “fair.” Only 12% indicated the alignment was “excellent”.


    • How would you rate your EDD’s collaboration with your state’s economic development department? Interesting, the collaboration responses were slightly more affirmative than alignment question. About 46% of the respondents indicated that the collaboration was “poor” or “fair,” while 54% indicated that it was “good” or “excellent.”


    • Where is the best collaboration occurring between your EDD and your state’s economic development department (note one)? Three responses were the most frequently noted by the respondents: Planning (55%), Infrastructure (30%) and Business Development (17%).


    • How could collaboration improve between your EDD and your state’s economic development department (note one)? Respondents highlighted three actions to improve collaboration: increased state funding (32%), states partner with EDD and state planning activities (32%), and more frequent interaction with state officials (18%).


    • Was your EDD involved in the development of the $1 million statewide planning grant? None of the EDD respondents indicated certainty that the EDD was involved with the grant with 77% indicating “no” and 23% noting they “weren’t sure.”


    • Is your state expecting your EDD to be involved in the execution of activities related to the statewide planning grant? About one-third of the respondents (33%) indicated that they expected their EDD to be involved in the execution of the statewide planning grant; 56% indicated “no.” These responses are an interesting contrast to the responses related to EDD involvement of the grant development.


    These panel and workshop sessions offered great insights into the alignment and collaboration for specific states and EDDs while also providing important EDD perspectives on alignment with state economic development departments.

    One-on-One Technical Assistance

    In addition to the Learning Lab and the panel workshop, CREC met with EDDs representing regions in Utah, Arkansas, Texas, Iowa, North Dakota, Ohio, Pennsylvania, and Virginia. The CREC team prepared customized fact sheets for each region to review findings from the state-local economic development strategies matrix. These findings provided insights into opportunities for increased collaboration, including how regions might support state efforts.

    The EDDs represented different regions of the U.S., and each EDD provided a unique perspective on state-local collaboration. These conversations provided insights on the status of the EDD’s current relationship with their respective state economic development organizations (EDOs) and where they would like to see more collaboration, including:

    • Generally, there’s a lack of communication between state EDOs and EDDs but planning efforts help to drive conversations between the entities.
    • Leadership and staff turnover at state EDOs make it extremely difficult for EDDs to maintain relationships at the state level.
    • Economic development ecosystems can be very segmented. A few EDDs did not have a direct connection with the state EDO’s leadership but had strong relationships with the state’s regional offices.
    • EDDs often face challenges to obtain funds for matching grants when required for projects.
    • State EDOs are most interested in collaborating with EDDs on infrastructure projects, such a broadband expansion and water and sewer infrastructure.
    • EDDs want to be in the room with state EDOs when they’re developing a strategic plan for the state and believe all partners will see value in that joint activity.

    Strength in Numbers: Best Practices for State Associations    

    Statewide associations play an important role in strengthening the organizational capacity of the nation’s regional councils and regional development organizations. Due to their importance, a session at the Annual Conference was organized to showcase statewide associations and encourage discussion on the subject among participants.

    Speakers from five states presented briefly on the associations and networks in their states, including Pennsylvania, Vermont, Idaho, Florida, and West Virginia. The presentations provided examples of the diverse range of missions, programs, budgets, and organizational structures that currently exist.  Participants learned about the value of building and maintaining a strong statewide association and best practices to leverage them to advocate, educate, and collaborate on behalf of regional organizations in their state. After presenting, the speakers sat at tables to discuss subjects raised during the presentations and challenges faced in individual states. Jill Foys, the presenter from Pennsylvania, then led report-outs from the groups and provided summary comments. Thanks to the interactive discussion and relevance of the subject, the session was very well received by participants and NADO staff intend to organize sessions on the subject at future conferences.

    Final Thoughts

    The Learning Lab, panel workshop, one-on-one TA and the state association session highlighted not only the value and opportunity of improved strategic alignment, but the strong interest of the EDDs to pursue stronger relationships with states. The EDDs benefited from the sessions by learning how to potentially work with states and CREC came away with a better understanding of the EDD-state relationship.

    The materials included on these State-Local Alignment webpages were prepared by the Center for Regional Economic Competitiveness using Federal funds under award ED21HDQ3070060 from the Economic Development Administration, U.S. Department of Commerce. The statements, findings, conclusions, and recommendations are those of the author(s) and do not necessarily reflect the views of the Economic Development Administration or the U.S. Department of Commerce.
  • State Incentive Program General Trends

    | by John Ponder White | August 24, 2022 |

    With the conclusion of the State Business Incentives Database summer update, the Council for Community and Economic Research (C2ER) will be publishing a series of blog posts. These blog posts will explore new and topical trends and provide analysis concerning how state incentive programs have changed. This inaugural post focuses on general trends and how programs have shifted over the past year. Of particular interest are the lingering effects of the COVID-19 pandemic and how it continues to shape program type and focus. The analysis of current general trends will be useful to compare to the coming years to see how the Infrastructure Investment and Jobs Act and the Inflation Reduction Act affect state programs.

    The first major trend concerns the recent decline in total quantity of state incentives programs. As COVID-19 relief programs are beginning to sunset, many states are taking the opportunity to rework their program portfolio. Many programs are being left in limbo until the next cash infusion from the federal government. Additionally, states are not replacing these programs either. Graph 1 shows the number of new programs added each year that are still currently active in the state incentive database. This year, 11 new programs were found, which is considerably fewer than any previous year. The lack of program replacement has resulted in a decrease in total active program, from 2,367 in the summer of 2021 to 2,354 as of today. Graph 2 shows that this is a very minor decrease, with far more programs still on the books than there were in 2015. As this is the first year that shows a decline, it is too soon to say if this is going to be indicative of future trends, or if new programs stemming from federal legislation will result in this being a one-year aberration.

    Graph 1. Number of new programs created each year since 1990

    Graph 2. Number of programs by year

    The second recognized major trend is the pivot away from tax-based programs since 2020. Programs can fall into multiple types and categories and address multiple needs. A program that has both a tax credit and grant component will be counted as both for the following analysis. Tax credits are the most common form of incentive in our database, making up roughly 25% of all the programs. Grant programs are the second most popular, making up roughly 22% of the programs. However, recent years have shown this trend changing. While Graph 3 shows that fewer grant programs have been created since 2020 than in the three years prior, the number of new tax credit programs has fallen by much more. Grant programs make up a total of 22 new programs created since the pandemic began, roughly 40% of the overall. In contrast, only 13 new tax credit programs were added, making up a much smaller share of new programs (24%).

    Graph 3. Program Types

    When looking at the broader program categories, the change in new program focus is even stronger. Since the pandemic there has been a dramatic shift from tax programs to direct business financing. Graph 4 shows that only 13 new programs that utilize taxes had been created in the last three years, while 44 were created in the three years prior. Comparatively, 29 programs pointing to direct business financing were created in the past three years. While this is a decrease from the 33 programs created between 2017 and 2019, the program type experienced a proportional increase. Grant programs and direct business programs are increasing at a higher rate than tax-based programs, resulting in the direction of state incentives shifting during the past three years.

    Graph 4. Program Categories

    This shift in program types and categories is not just regulatory, but indicative in what needs are being addressed by new state incentives. Graph 5 shows that states have shifted from tax and regulatory burden reduction to capital access funds. While fewer total programs addressing capital access needs were added since the start of the pandemic, they make up roughly 36% of the new programs. In contrast, only 13 new programs addressing tax and regulatory burdens were added, making up a much smaller share of 19% of new programs. This shows a shift in both desired outcome of state incentive programs as well as a shift in strategy.

    Graph 5. Program Needs

    Looking to the future, we will see if these trends continue after the passage Infrastructure Investment and Jobs Act and the Inflation Reduction Act, or if this was an outlier deviation caused by waning of the COVID-19 pandemic and sunsetting of programs created to specifically address the outbreak. If we continue to see a rise in grant programs, direct business financing programs, and programs addressing capital access we will know that a longer-term shift has been made, and not just emergency adjustments.

    This article was written by John Ponder White, Economic Development Research Intern, Center for Regional Economic Competitiveness. It first appeared on the Council for Community and Economic Research blog.

  • EDA’s $1 Million Statewide Planning Grants: How Did the States Use It?

    | August 24, 2022 |

    Through the American Rescue Plan (ARPA), the Economic Development Administration (EDA) is supporting states in economic planning efforts by allocating $59 million in grants through the Statewide Planning, Research & Networks program. To better understand how states are using these funds, the Center for Regional Economic Competitiveness (CREC), in partnership with the State Economic Development Executives (SEDE) Network, conducted a survey of states during the summer of 2022 to learn how the $1 million grant funds were used.  

    Past Spending 

    Overall, 38 states responded. Of these, 19 states indicated they had spent at least some of their Statewide Planning Grant (including two that had spent the entire allocation). These states are using grants for a variety of EDA-identified activities with the following three representing the most frequent responses: 

    • Eleven states (57.9%) are planning to identify industry clusters,  
    • Eight states (42.1%) are identifying state assets to benefit the state in regional and global markets, and  
    • Seven states (36.8%) are bringing together existing local, regional and workforce related plans.  

    Other responses included 3 states which are assessing supply chains to increase efficiency or supporting broadband installations (15.8% each). Two states, a little over 10 percent, are conducting skills analyses (10.5%) and cataloging innovation gaps between urban and rural areas (10.5%). And one state is creating strategies to address communities in poverty, with another making plans to coordinate with indigenous communities. 

    Future Spending 

    The 36 states with funds remaining expect to continue current efforts and/or expand funding to several EDA-identified activities: 

    • Nineteen states (53%) intend to make plans to identify industry clusters,  
    • Eighteen states (50%) expect to compile existing economic, workforce, and other related plans and,  
    • Eighteen states (50%) also plan to identify assets to benefit their state in regional and global markets.  
    • Eleven states, over one fourth, plan to catalog innovation gaps between urban and rural areas and 8 states, over one fifth, plan to assess supply chains and logistics to increase their efficiency.  

    Seven states plan to conduct statewide skills assessments and/or support broadband expansion. And 6 states (15.8%), say they will create strategies to assist chronically impoverish communities and/or help indigenous communities to coordinate plans.  

    Collaboration 

    When EDA proposed the State Planning Grants, it stated that one major goal of ARPA Networks grants was to help develop “communities of practice”. Interestingly, only 2 states included regional organizations in the application development process. However, 23 states said they are including regional organizations in the activities funded by the grant, so EDDs will still play a significant collaborative role.  

    The EDA began soliciting Statewide Planning Grant applications in July of 2021. The relatively long turnaround (applications were due May 24, 2022) may have served to reduce post hoc changes to grant plans. Indeed, only six states indicated that their spending plans had changed in any “significant” way from what they proposed upon application. Five of the six states are not currently funding activities but do plan to in the future. There was one exception, which is currently identifying resources and assets to benefit the state in regional and global markets but indicated it did not expect to fund activities in the future. This likely indicates that their grant is almost fully expended.   


    The materials included on these State-Local Alignment webpages were prepared by the Center for Regional Economic Competitiveness using Federal funds under award ED21HDQ3070060 from the Economic Development Administration, U.S. Department of Commerce. The statements, findings, conclusions, and recommendations are those of the author(s) and do not necessarily reflect the views of the Economic Development Administration or the U.S. Department of Commerce.

  • New Findings on Remote Worker Attraction Programs & Lessons for Communities Striving to Attract Remote Workers

    | SEDE Network Incentives Roundtable | April 5, 2022 |

    Remote worker attraction programs represent an exciting innovation for state and local economic development. Recent studies examined two of the longest-standing remote worker attraction programs: the Vermont New Remote Workers Grant Program and Tulsa Remote. Panelists at a recent roundtable shared their findings on the effectiveness of worker attraction incentives.

    • Evaluations of remote worker incentive programs in Vermont and Tulsa found that they have been effective in attracting new people and are generating net economic gains at relatively low costs
    • While they differed in style and approach, both studies concluded that remote worker incentives have provided a positive return on investment.
    • The evaluations also identified other benefits not captured in the impact models, such as attracting above-average income earners and individuals with age, experience, and education profiles that bolster the workforce.
    • The long-term effects are still to be determined, but early signs are promising in both places based on retention and home ownership rates.
    • Communities considering remote worker programs should know:
    • Incentives are unlikely to be the only reason for an individual’s relocation decision, but they can be an important factor for many and provide an “extra push” to encourage individuals to make the move.
    • Incentives are most effective when they are part of holistic economic development strategies. Places that are considering these incentives should embrace what makes their community great – but also understand/address the factors that may make relocation difficult.
    • Incentives tend to resonate with people who have some connection to or experience in your community already.
    • Relocating remote workers are seeking to make meaningful connections within their new communities. Building community connections is important to helping remote workers put down roots and creating places where people want to be.

    Introduction

    Economic development leaders and evaluators considered how effective state and local incentives can be in bringing new remote workers to communities during the recent SEDE Network roundtable program, New Findings on Remote Worker Attraction Programs.

    The roundtable presented findings from recent evaluations of two of the longest-standing remote worker attraction programs: the Vermont New Remote Workers Grant Program and Tulsa Remote, both launched in 2018. Joan Goldstein, Commissioner for the Vermont Agency of Commerce and Community Development, provided a leadership perspective on the economic development benefits of Vermont’s remote worker attraction programs. Deanna Kimball from PFM Group Consulting then discussed findings on a series of questions the Vermont legislature posed regarding the effectiveness of Vermont’s programs. Kenan Fikri with the Economic Innovation Group reported on takeaways from their study of Tulsa Remote.

    This white paper summarizes the major themes from the roundtable presentations. To dive deeper, please see the full slide deck from the roundtable or watch the roundtable video to hear directly from the panelists.

    Remote Worker Incentives in Vermont and Tulsa

    Vermont’s New Remote Worker Grant Program was created by the state legislature in 2018. The $500,000 allocated for the original program was exhausted in 2020. The program was reconstituted under the 2021 New Relocating Employee Incentives Program, and $130,000 was made available for remote workers becoming full-time residents on or after February 1, 2022.

    The current program provides grants up to $7,500 to remote workers who relocate to Vermont. Grants are structured as reimbursements for eligible relocation expenses. The program is administered by the Vermont Agency of Commerce and Community Development (ACCD). Individuals must complete a grant application and survey. Grants are then awarded on a first-come, first-served basis, and funds are disbursed in accordance with a grant agreement. In its first iteration, the program provided grants to 140 qualified recipients, with actual grant amounts ranging from $401-$5,0000 and an average of $3,571.

    Tulsa Remote was created, funded and administered by the George Kaiser Family Foundation starting in 2018. The program targets people who work from home and incentivizes them to relocate to Tulsa for at least one year. Tulsa Remote offers a $10,000 grant along with resettlement assistance, co-working space membership, and social activities and networking events. Individuals submit an application and are selected by the Tulsa Remote team based on their willingness to relocate within Tulsa city limits and contribute to the community and economy, plus considerations of their potential economic impact, degree of community engagement, and likelihood to stay. Funds are disbursed in phases for relocation expenses, a monthly stipend, and at the end of the first year. Approximately 1,200 remote workers had moved to Tulsa by the end of 2021, though not all stayed beyond their commitment. Kenan Fikri explained that the state of Oklahoma is now starting to reimburse a large part of the incentive.

    Both programs received substantial media attention as early examples of remote worker attraction incentives. Joan Goldstein noted that Vermont found the incentive to be “an unbelievable marketing tool– a way to put Vermont on the map nationally and internationally” for economic development in an unprecedented way.

    Study Findings: Are They Effective?

    While they differ in style and approach to determining effectiveness, both studies chose to use individual or household income (rather than the number of new jobs) to estimate economic impact. Both concluded that remote worker incentives have provided a positive return on investment.

    The Vermont Remote Worker program yielded positive employment, output, and fiscal benefits under a primary scenario and several alternatives that were modeled based on estimates of household income associated with the new remote workers gleaned from surveys of grant recipients. The evaluation estimated the 140 remote workers had aggregate household income of $16.5 million, indicating incomes that exceed the state average. The primary scenario then adjusted the total economic and fiscal impact to reflect the percentage of survey respondents who said the grant was important or very important to their decision (52%). This adjustment, which essentially discounted the maximum potential impact, yielded a total employment impact of 65 jobs (not counting the remote workers themselves) from household spending and annual economic output of $9.5 million. The PFM team found that, “in the aggregate, these are significantly positive programs with substantial return per tax dollar spent,” further noting that “economic and fiscal impacts are ongoing.”

    The Tulsa Remote impact analysis also found positive employment and income effects, drawing on data from a survey of grant recipients. The analysis is based on the 394 remote workers present for the whole year in 2021. These workers directly accounted for $51.3 million in income in 2021, with a total impact of 592 full-time equivalent jobs and $62 million in new local earnings. This means that every dollar spent on the incentive produced $13.77 in new labor income in the county. Estimated impacts were not adjusted to reflect the importance of the incentive to relocation decisions. As in Vermont, remote worker incomes exceeded the local average. The median income of the remote workers was $85,000 in 2021, while Tulsa’s median income is approximately $58,000. EIG also concluded that Tulsa would see additional impacts from the remote workers in the years ahead.

    The evaluations also identified other economic development benefits not captured in the impact models. In addition to the above-average income findings in both places, Vermont learned that the remote workers were younger than many of the state’s in-migrants, a positive workforce indicator. Tulsa reported that 31% of remote workers are employed in professional services and 14% in the information sector, compared to 17% and 2% locally, and nearly 90% of incentivized remote workers hold a bachelor’s degree, supporting the goals to attract and retain highly educated workers in high-wage fields.

    The long-term effects are still to be determined, but early signs are promising in both places.

    • In Tulsa 4 in 10 are homeowners, and of those who are not, another 4 in 10 are at least slightly likely to purchase a home w/in a year
    • 74% of Vermont remote worker grant survey respondents own their residence
    • Tulsa has seen an 87.5% retention rate to date, while 97% of Vermont remote worker grant survey respondents still live in the state

    Topics for Communities Considering Remote Worker Programs

    1. Communities should acknowledge that incentives are unlikely to be the only reason for an individual’s relocation decision, but they can be an important factor for many.
    • 52% of survey respondents in Vermont said the grant was important or very important to their decision.
    • Joan Goldstein pointed out that in today’s workers’ market, places are competing on amenities – not just tax breaks or incentives. In Vermont, access to outdoor recreation and nature, the perception of Vermont as a safe place to live and raise a family, and access to community/cultural amenities were the top factors influencing the decision to move to Vermont.
    • Across the country, individuals who are relocating (not just relocating remote workers) also say being closer to family and friends and more affordable living are their top reasons for making a move.
    1. Incentives are most effective when they are part of holistic economic development strategies. As Deanna Kimball explained, places that are considering these incentives should embrace what makes their community great – but also understand/address the factors that may make relocation difficult.
    • Strategies need to address the factors that might impede relocation decisions. Depending on the community, these might include available and affordable housing options, access to quality childcare at a reasonable cost, and high-quality and reliable broadband.
    • Outreach and promotion for remote worker incentives should complement tourism and other community marketing efforts.
    • Incentives should be approached as a collaborative effort with economic development partners to maintain buy-in and make sure interested neighborhoods and communities are “relocation ready” and in a position to benefit.
    1. The incentives tend to resonate with people who have some connection to or experience in your community already. Kenan Fikri noted that going forward differentiation and careful targeting (to your local diaspora, for example) may become the key to success as remote worker incentives become more common.
    • In Tulsa, 39% reported having a family connection to the area before moving. 21% are “boomerangs” who previously lived in Tulsa
    • In Vermont, 50% of remote worker recipient survey respondents have family in Vermont, and 24% had been a resident previously
    • Panelists noted that the incentive can provide that “extra push” to encourage individuals to make the move back.
    1. Relocating remote workers are seeking to make meaningful connections within their new communities.
    • Tulsa offers programming to remote workers directed at community building that includes networking events and social activities as well as a website for sharing experiences.
    • Memberships to local cultural organizations, business and community networking opportunities, and free access to co-working spaces are common approaches to building connections.
    • Community connections are important to helping remote workers put down roots and “make the places sticky” so people want to be there.

    Conclusion

    Remote worker incentive programs represent an exciting innovation for state and local economic development. The remote worker attraction programs considered here have been small but impactful, creating a new set of economic development opportunities for both Vermont and Tulsa. They have been effective in bringing people to new locations and are generating net economic gains. The long-term benefits are yet to be determined, but early indicators around home ownership and retention rates are positive. Remote worker incentives that are integrated with other economic development and marketing strategies, engage partners and stakeholders, and that help remote workers build connections with their new communities are most likely to be successful.


    by  | Apr 24, 2022

    Remote worker attraction programs represent an exciting innovation for state and local economic development. Recent evaluations of remote worker incentive programs in Vermont and Tulsa found that they have been effective in attracting new people and are generating net economic gains. Panelists at a recent roundtable shared these perspectives on what makes worker attraction incentives effective.

    Communities should acknowledge that incentives are unlikely to be the only reason for an individual’s relocation decision, but they can be an important factor for many and provide an “extra push” to encourage individuals to make the move.

    Incentives are most effective when they are part of holistic economic development strategies.  Places that are considering these incentives should embrace what makes their community great – but also understand/address the factors that may make relocation difficult. Strategies should address the factors that might impede relocation decisions.

    Incentives tend to resonate with people who have some connection to or experience in your community already. In Tulsa, 39% reported having a family connection to the area before moving.  21% are “boomerangs” who previously lived in Tulsa. In Vermont, 50% of remote worker recipient survey respondents have family in Vermont, and 24% had been a resident previously.

    Relocating remote workers are seeking to make meaningful connections within their new communities. Memberships to local cultural organizations, business and community networking opportunities, and free access to co-working spaces are common approaches to building connections. Building community connections is important to helping remote workers put down roots and creating places where people want to be.

    This article is drawn from New Findings on Remote Worker Attraction Programs. This white paper summarizes the major themes from the April 5, 2022, roundtable of the same name, sponsored by the State Economic Development Executives network and hosted by the Center for Regional Economic Competitiveness. The roundtable panel discussed findings from recent evaluations of two of the longest-standing remote worker attraction programs: the Vermont New Remote Workers Grant Program and Tulsa Remote.

  • Highlighting Opportunities for States and Economic Development Districts (EDDs) to Better Align Economic Development Planning Strategies

    March 2022 Project Presentation at NADO’s Washington Policy Conference: Highlighting Opportunities for States and Economic Development Districts (EDDs) to Better Align Economic Development Planning Strategies

    | March 17, 2022 |

    At the National Association of Development Organizations (NADO) Policy Conference in March, the EDA, CREC, and Economic Development Districts (EDDs) from Arkansas and New Mexico discussed approaches to improved collaboration with state governments. Ryan Smith from EDA spoke about how CARES Act and ARPA funding is allowing regional partners to make transformative investments, and EDA is working to understand how states can partner with them and be more supportive of local ideas. To improve state-local strategic collaboration, EDA is funding a project with CREC to better align state and local economic development planning strategies.

    Mereb Hagos, representing CREC (the project lead), noted that two thirds of EDDs surveyed in a recent survey reported fair or poor collaboration with their state, highlighting the importance of improved alignment and collaboration. CREC is working with NADO to finalize a matrix comparing regional Comprehensive Economic Development Strategies (CEDS) and state economic development strategic plans. CREC presented preliminary results showing that CEDS most often align with state programs on workforce, industry clusters, and admin/governance. Other project partners include the State International Development Organizations (SIDO) and American Manufacturing Communities Collaborative (AMCC).

    Presenters also explained that EDDs must invest in their relationship with state agencies and use their expertise and value proposition to illustrate their importance to state projects. Mark Goodman from the East Arkansas EDD outlined possibilities for collaboration and the active role EDDs can and should play in their relationship with state offices. He shared several effective engagement strategies including engaging state employees where they are, identifying what they need, and seeking public venues to promote the value of Districts.

    For example, EDDs should be able to answer the question “what do you do?” when talking to their state.  Raymond Mondragon and Vincent Soule from the Eastern Plains COG in New Mexico explained how the designation of a new interstate highway was only possible because of their consistent collaboration with state and federal agencies. Finally, the EDA reiterated that the project should determine what is working well, what needs to improve, and how to share future ideas from CREC’s analysis.


    The materials included on these State-Local Alignment webpages were prepared by the Center for Regional Economic Competitiveness using Federal funds under award ED21HDQ3070060 from the Economic Development Administration, U.S. Department of Commerce. The statements, findings, conclusions, and recommendations are those of the author(s) and do not necessarily reflect the views of the Economic Development Administration or the U.S. Department of Commerce.

  • How States are Using EDA Statewide Planning and Tourism Grants

    | November 14, 2021 |

    Hockey sticks. Good for handling pucks but also for describing rapid revenue growth. Under the American Rescue Plan, the U.S. Economic Development Administration (EDA) was allocated $3 billion in supplemental funding to assist communities recover from the coronavirus pandemic and build local economies that will be resilient to future shocks. In normal years, EDA generally receives around $300 million so hockey stick growth isn’t reserved for early-stage companies.

    The State Economic Development Executives (SEDE) network is interested in learning more about how states would be spending the $59 million in the non-competitive State Planning Grants and $510 million in the non-competitive State Tourism Grants. The Center for Regional Economic Competitiveness conducted two surveys to learn state plans for each of the two grants.

    State Planning Grants

    Officials from 15 states completed the State Planning Grant survey and the most frequently use of grant funds cited (more than one use could be noted) was to identify state assets/resources and develop plans to benefit the state (9 respondents).  Eight respondents indicated that they expect to use the funds to develop industry cluster plans, bring together existing local and regional economic/workforce and related plans and/or conduct a statewide skills assessment analysis.

    A handful of states reported that they expected to use the funds to complete a supply chain assessment, support broadband planning, catalog innovation assets including a rural/urban gap, analyze persistent poverty communities and/or facilitate coordination with tribes/indigenous communities

    Few states expected to contribute supplemental funding to the EDA grant however most states (11) reported Economic Development Districts (EDDs) were involved in the grant application or will assist in the completion of regional activities funded by the grant.  Only four states indicated that the EDDs are not involved in the grant.

    State Tourism Grants

    Twenty (20) states and territories completed the State Tourism Grant representing nearly every region. With 18 respondents, the most popular use of the funds was marketing campaigns. A general “other uses as approved by EDA” was the second most common response (11) reflecting innovation by state tourism offices. Of those indicating marketing uses, 14 expected at least 50 percent of the grant would fund that activity. None of the remaining uses received more than six responses: workforce training, economic planning, industry technical assistance, upgrades to industry infrastructure and projects boosting long-term tourism activity.

    Two states reported that state funds would supplement the EDA grant but 13 would be passing some grant funds through to other organizations to administer. Unlike the State Planning Grant, most states did not expect to work with EDDs on the State Tourism Grant with four indicating EDD involvement.

    Some common responses within each survey, but also some interesting variation. It will be interesting to see the impacts of these grants on state economies and tourism activity.

    The materials included on these State-Local Alignment webpages were prepared by the Center for Regional Economic Competitiveness using Federal funds under award ED21HDQ3070060 from the Economic Development Administration, U.S. Department of Commerce. The statements, findings, conclusions, and recommendations are those of the author(s) and do not necessarily reflect the views of the Economic Development Administration or the U.S. Department of Commerce.

  • Learning Local Perspectives on State and EDD Alignment

    | November 14, 2021 |

    At the October 2021 NADO Annual Training Conference, Bob Isaacson from the Center for Regional Economic Competitiveness (CREC) had the opportunity to discuss state and local EDD alignment and collaboration with about 23 individuals (generally representing EDDs). The discussion was fueled by a live survey; the survey results and subsequent discussion are below:

    Survey Results and Discussion

    1 – Does your state fund your local development district?

    • About a 50/50 split although few are general funding with other funded for specific tasks
    • Kentucky matches any funding received by EDDs
    • The Iowa Council of Governments (COGs) receives state funding
    • Although many attendees noted they receive some funding for specific services, most do not receive any general appropriation or funding
    • Some states had general funding, but most did not. The ones that did were generally created through state legislation

    2 – How would you rate the alignment of your CEDS with the state’s economic development strategy?

    • About 35 percent indicated poor alignment; about 65 percent said fair or less
    • General theme was that the states don’t know about EDDs and don’t respect what they can do
    • Attendees noted that when EDDs are included, it’s just lip service and no buy-in to EDD perspectives
    • Colorado noted that they collaborate with state
    • Idaho has state-funded staff working in EDDs, but they aren’t collaborating – just in doing a single job
    • States develop plans top-down rather than bottom-up – not inclusive
    • State plans are often not transparent or politically motivated and/or change with each governor
    • State plans often don’t cover all factors present in CEDS – housing and workforce, for example

    3 – Did your EDD collaborate with your state on any EDA grant applications in 2021?

    • 59 percent indicated “yes”; 41 percent reported “no”

    4 – How would you rate the collaboration between your economic development district and state economic development department?

    • 30 percent reported poor collaboration with 71 percent reporting fair or worse
    • EDA “encourages” collaboration between state and EDDs – should be required
    • Many participants noted that the alignment is poor/fair and when they are given seat at the table their suggestions are rarely included in action steps.
    • Colorado EDDs refer businesses to the State Trade Expansion Program (STEP); would like SBA to steer some federal STEP dollars to substate organizations
    • Several EDDs noted they work with state on business attraction/recruitment
    • How many state leaders read CEDS?
    • Challenge with state leader engagement is that not all areas are represented by an EDD
    • EDRs can assist with state leadership engagement
    • To really understand EDDs, important to visit some on the ground.
    • Some states are relying on EDDs for COVID relief – could be a good model to follow

    5 – What barriers prevent or limit collaboration?

    • The survey respondents indicated poor communication (8%), state doesn’t have a plan (15%), resource constraints (8%), all the above (31%), N/A or other (38%)
    • States view EDD involvement as sometimes just lip service


    Task Discussion Responses

    Task 1 – Are there any examples of state-local collaboration on international engagement strategies within your community or elsewhere?

    • Many participants noted that their EDD have been providing international engagement (e.g., imports, exports, FDI) for many years but there is minimal collaboration with state.
    • International engagement is baked into EDD activities so sometimes not called out separately

    Task 2 – Do you have the necessary tools and resources to develop informed strategies on issues such as workforce talent development, supply chain vulnerabilities, reshoring, etc.?

    • EDDs believed that they had the tools to develop informed strategies on variety of service areas. but do not have adequate resources to provide the assistance to clients. They must prioritize services and assistance.

    Task 3 – Are there examples of good outreach or technical assistance to incorporate international engagement strategies into local CEDS?

    • Many EDDs indicated they have been doing international engagement strategies and services for years and it is part of their CEDS.
    • If an administrations doesn’t fund Select USA, the EDDs focused on other programs. If Select USA and international engagement are a priority today, many EDDs need funds to hire staff needed to work on the issue.

    Would you join bi-annual meetings of state economic development agency leaders to advance effective practice and better align with EDA goals?

    • General agreement that they would join meetings with state ED leaders. It would be helpful if a third party (e.g., CREC) scheduled and facilitated the meeting.
    • Needs to be institutional so change in administrations doesn’t change org relationships


    The materials included on these State-Local Alignment webpages were prepared by the Center for Regional Economic Competitiveness using Federal funds under award ED21HDQ3070060 from the Economic Development Administration, U.S. Department of Commerce. The statements, findings, conclusions, and recommendations are those of the author(s) and do not necessarily reflect the views of the Economic Development Administration or the U.S. Department of Commerce.